
The Sutton Trust, in conjunction with CEM at The University of Durham, has just released a report, “Toolkit of Strategies to Improve Learning” which summarises the ways in which schools might select to spend their Pupil Premium, weighing up potential gains (in terms of months) against estimated cost.
I really recommend going to The Sutton Trust website and reading their own synopsis of the report and, at the same time taking the opportunity to check out everything they are involved with to reduce social barriers to learning. The report itself is a fascinating read, providing as it does, a summary of the research evidence on improving learning and attainment to help schools make informed choices about how to support their pupils who are eligible for the additional funding that comes with the Pupil Premium. I’ve included the document below.

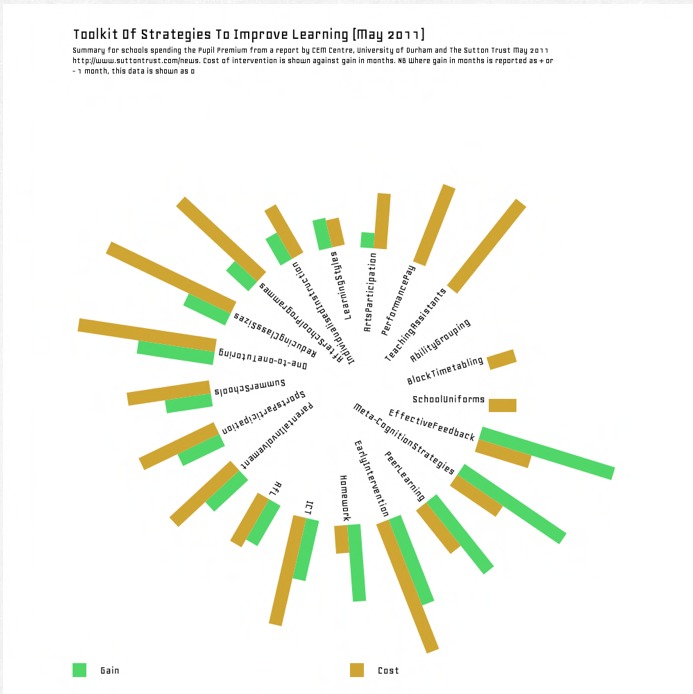
The infographics at the top and the bottom of this post are my very first attempts to visualise the data on pages 5-7 in the report. The graphic at the top shows the relative cost to gain (in months) for the interventions they looked at. The graphic below is a simmary of the highest impact interventions (aside from the cost).
I’ve just discovered NumberPicture which is a bit like wordle for data. It is a very exciting discovery for a non-coder like me and something I could see learners getting really engaged with.


Really nice info graphics to support some interesting content, it is interesting to see the size of cost to gain ratio in some areas!
Thank you for your feedback. I agree, it is very interesting (and reassuring in many ways) to see what is ‘cost effective’ in this way. I love the infographic site too!
Hi Zoe.Those infographics are genuinely awesome. I’m really impressed you’ve made them yourself and can’t believe I didn’t see them earlier/ I will have to check out Numberpicture in more detail.That’s rather scary info about Teaching Assistants and (for me) rather pleasing about the ability grouping since we’re starting the move to mixed ability maths teaching next year.Talk to you soon no doubt.Dave@reflectivemaths